
 EN
Overview
Fluorescence intensity measures light emitted by a fluorophore following excitation. A fluorescence microplate reader selects excitation and emission wavelength bands and measures the resulting signal from each well. The method supports assays for labelled biomolecules, nucleic acids, enzyme activity and cellular responses. [1]
How the signal is generated
A fluorophore absorbs excitation light and subsequently emits fluorescence, usually at a longer wavelength. Excitation and emission filters or monochromators select the relevant spectral bands. Fluorescence intensity depends on the number of fluorescent molecules and their photophysical environment, as well as the excitation, optical collection and detector settings. The same fluorophore concentration can produce different signals under different assay conditions.
Understanding relative fluorescence units
Readers commonly report relative fluorescence units, or RFU. These values depend on the instrument and measurement settings; they are not an absolute concentration scale. Comparing raw RFU across instruments or different gain settings requires an appropriate calibration strategy. For concentration measurements, use standards suitable for the assay matrix and confirm the working range. Background subtraction alone does not establish linearity.
Choosing top or bottom reading
Top reading measures from above the sample and is often used for homogeneous solution assays. Bottom reading measures through the plate base and can be useful for adherent cells. The best geometry depends on sample location, volume, labware and the assay. Use plates intended for the measurement, and evaluate well-to-well optical cross-talk where strong and weak signals are adjacent. [2]
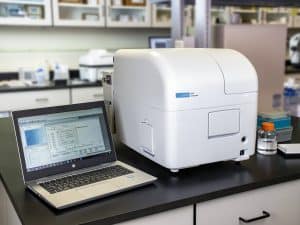 With live cell assays, the cell layer at the bottom of well can present a challenge for systems that read only from the top – it can be difficult to get optimized sensitivity when the excitation and emission optics are physically distance from the sample. Synergy Neo2 has both top and bottom measurement without using fiber optics. This direct bottom illumination ensures maximum sensitivity with minimum light loss, due to the proximity of the optics to the plate bottom. Direct bottom illumination provides an advantage for luminescence assays such as ATP cell viability, GFP transfection and cell migration assays.
Although direct bottom illumination provides increases sensitivity for adherent cell-based assays compared to top reading, other Agilent instruments like the Cytation 9 cell imaging multimode reader combines microscopy and multimode plate reading to provide even more sensitivity for cell-based assays.
Controlling assay interference
Include reagent blanks, relevant negative controls and suitable positive controls. In cell assays, medium autofluorescence, cell number, compound fluorescence and spectral bleed-through can affect the result. Photobleaching and quenching can reduce fluorescence. At higher optical densities, absorption of excitation light or emitted fluorescence produces inner-filter effects and can cause non-linear concentration responses. These effects have been experimentally characterised in microplate measurements. [3]
Interpreting a bulk fluorescence measurement
A well-level signal combines contributions from the measured sample volume. A change can reflect altered cell number, reporter expression, probe loading or the biological process under study. Normalisation and orthogonal measurements help distinguish these possibilities. Fluorescence imaging adds spatial information and can reveal whether a response is uniform or confined to a subpopulation. Hybrid readers provide filter-based and monochromator-based options, but the best optical configuration is assay-dependent. [2]
Common questions
Can RFU be converted into concentration?
Yes, when a suitable calibration curve or validated quantitative model is available under the actual measurement conditions.
Is fluorescence always more sensitive than absorbance?
No universal comparison applies. Detectability depends on the label, chemistry, background, optics and sample. Fluorescence can support low detection limits, but interference must be evaluated.
Need help selecting a platform for your assay? Contact BioSPX to discuss the sample, readout and configuration you need.
References
[1] Agilent Fluorescence intensity
[2] Agilent BioTek microplate reader FAQs