
 EN
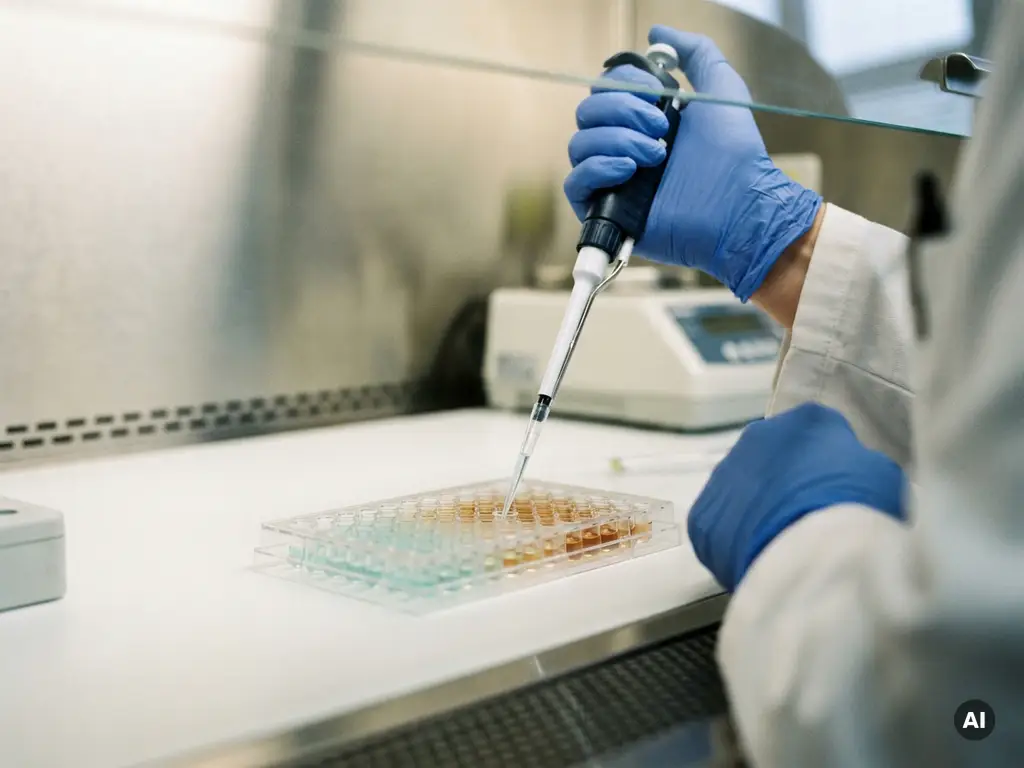
Researchers quantify cytolysis in cancer cell killing experiments using a combination of biochemical release assays, fluorescence-based detection, and flow cytometry. The most widely used approach measures the release of intracellular enzymes or fluorescent markers from lysed target cells, providing a quantifiable readout of immune-mediated or drug-induced cell death. The sections below unpack the most common methods, the variables that affect measurement accuracy, and the considerations for choosing the right assay format.
What methods are used to measure cytolysis in cancer research?
Cytolysis in cancer research is measured using biochemical release assays, fluorescence- and luminescence-based detection methods, flow cytometry, and live-cell imaging platforms. Each approach detects a different marker of cell membrane disruption or cell death, and the choice of method depends on the experimental model, throughput requirements, and the type of effector cells being studied.
The most established cytolysis detection methods fall into several broad categories:
- Enzyme release assays: Measure cytoplasmic enzymes such as lactate dehydrogenase (LDH) that leak from lysed cells into the culture supernatant
- Fluorescence-based assays: Use fluorescent dyes pre-loaded into target cells, with dye release or retention indicating membrane integrity
- Luminescence assays: Detect bioluminescent reporters expressed in target cells, offering high sensitivity in low-volume formats
- Flow cytometry: Discriminates live, early apoptotic, and necrotic cell populations using viability dyes and annexin V staining
- Live-cell imaging: Tracks cytolysis kinetics in real time without endpoint fixation, preserving temporal resolution
In cancer immunotherapy research, these methods are applied to evaluate the killing capacity of natural killer (NK) cells, cytotoxic T lymphocytes (CTLs), chimeric antigen receptor (CAR) T cells, and antibody-dependent cellular cytotoxicity (ADCC) mechanisms. Researchers in the Benelux region working across oncology, immunology, and drug discovery regularly rely on combinations of these approaches to build a complete picture of cytotoxic activity.
How does the LDH release assay quantify cell death?
The LDH release assay quantifies cell death by measuring the amount of lactate dehydrogenase released into the cell culture supernatant when target cell membranes are disrupted. LDH is a stable cytoplasmic enzyme present in virtually all cell types, and its extracellular concentration is directly proportional to the number of lysed cells. The assay produces a colorimetric or fluorometric signal that can be read on a standard plate reader.
In a typical cancer cell killing assay, target cells are co-cultured with effector cells such as NK cells or T cells for a defined period. At the endpoint, the supernatant is collected and incubated with an LDH detection reagent. The resulting signal is compared against a maximum lysis control, where all target cells are lysed using a detergent, and a spontaneous release control, where target cells are cultured without effectors.
Percentage cytolysis is then calculated using the formula:
% Cytolysis = [(Experimental LDH release – Spontaneous release) / (Maximum release – Spontaneous release)] x 100
The LDH release assay is valued for its simplicity, compatibility with standard multimode readers, and the absence of radioactive materials, which made it a preferred alternative to the older chromium-51 release assay. However, researchers should be aware that LDH is sensitive to spontaneous release from damaged or over-confluent cultures, which can elevate background and reduce assay sensitivity.
What role does flow cytometry play in cytotoxicity assays?
Flow cytometry plays a central role in cytotoxicity assays by enabling researchers to simultaneously distinguish target cells from effector cells and quantify the proportions of live, apoptotic, and necrotic cells within a mixed population. Unlike endpoint colorimetric assays, flow cytometry-based cytotoxicity measurement provides multiparametric data at the single-cell level, offering mechanistic insight beyond a simple lysis percentage.
In a flow cytometry cytotoxicity assay, target cells are typically labeled with a fluorescent dye before co-culture with effector cells. After incubation, the mixed population is stained with viability markers such as propidium iodide or a live/dead fixable dye, and optionally with annexin V to identify early apoptosis. The instrument then counts thousands of events per sample, allowing precise calculation of target cell survival.
This approach is particularly valuable in NK cell cytotoxicity and T cell killing assay formats because it allows researchers to:
- Distinguish target and effector populations without physical separation
- Detect both apoptotic and necrotic death pathways
- Analyze rare cell populations within complex co-cultures
- Correlate surface marker expression with cytolytic activity
Flow cytometry-based cytotoxicity assays are well suited to research questions that require mechanistic detail rather than simple throughput, making them a standard tool in cancer immunotherapy research across academic and pharmaceutical laboratories in the Benelux.
How do effector-to-target ratios affect cytolysis measurements?
The effector-to-target (E:T) ratio directly determines the magnitude of cytolysis measured in a cancer cell killing assay. A higher ratio of effector cells to target cells generally increases the probability of lethal contact events, producing greater measured lysis. Conversely, low E:T ratios may underestimate cytotoxic capacity, particularly for effector populations with moderate killing efficiency.
Standard cytotoxicity assays test multiple E:T ratios, typically ranging from 1:1 to 50:1, to generate a dose-response curve. This approach reveals whether cytolytic activity is linear, saturating, or non-specific at high effector concentrations. Comparing the E:T ratio required to achieve a defined level of lysis is a common way to rank the potency of different effector cell preparations or immunotherapeutic agents.
Several factors interact with the E:T ratio to influence measured cytolysis:
- Target cell density: Overcrowded wells can mask cytolysis signals and elevate spontaneous LDH release
- Incubation time: Short incubation periods may underrepresent slow-killing mechanisms such as perforin-independent pathways
- Effector cell activation state: Freshly isolated and expanded effector cells may behave differently at the same nominal E:T ratio
- Assay format: Some detection methods saturate at high lysis levels, compressing the dynamic range at elevated E:T ratios
Reporting E:T ratios clearly in publications is essential for reproducibility. Inconsistent ratio reporting is a recognized source of inter-laboratory variability in cytolysis quantification studies.
Which cytolysis assay is best for high-throughput cancer screening?
For high-throughput cancer screening, luminescence-based cytotoxicity assays and fluorescence reporter systems are generally the most practical choices. These formats are compatible with 96-well and 384-well plate configurations, generate stable signals, and can be read rapidly on multimode plate readers, enabling researchers to screen large compound or cell libraries within a single experimental run.
Luminescence assays that detect ATP content as a surrogate for cell viability offer excellent sensitivity and a wide dynamic range, making them well suited to drug-induced cytolysis screening campaigns. Fluorescent reporter-based assays, where target cells stably express a fluorescent protein, allow non-destructive monitoring and can be adapted for kinetic reading formats.
The LDH release assay remains widely used in medium-throughput settings due to its low cost and broad instrument compatibility, but it requires supernatant transfer steps that can introduce variability at scale. Flow cytometry, while highly informative, is generally not suited to primary high-throughput screening because of its lower sample throughput and the time required for data acquisition and analysis.
When selecting a cytolysis assay format for high-throughput cancer screening, researchers should consider:
- Compatibility with automated liquid handling to reduce pipetting variability
- Signal stability over the read window, particularly for time-sensitive luminescent substrates
- The ability to distinguish target cell death from effector cell signals in co-culture formats
- Plate reader availability and detection mode requirements
- Assay miniaturization potential and reagent cost per well at scale
Automation-compatible assay formats are increasingly important for research organizations in Belgium and the Netherlands aiming to increase experimental throughput without proportionally increasing manual labor or reagent consumption.
What are the most common sources of error in cytolysis quantification?
The most common sources of error in cytolysis quantification include elevated spontaneous release from target cells, signal interference from effector cell components, inconsistent effector cell quality between experiments, and pipetting variability during supernatant collection. Each of these factors can distort the calculated percentage of specific lysis and reduce the reproducibility of results across experiments or laboratories.
Spontaneous LDH release is a particularly frequent issue. Target cells that are stressed, over-passaged, or cultured at high density will release LDH before any effector contact occurs, raising the background and compressing the assay’s dynamic range. Researchers are advised to confirm target cell viability immediately before setting up co-cultures and to keep spontaneous release below accepted thresholds for the assay in use.
Effector cell variability is another significant contributor to inconsistent cytolysis measurements. Donor-to-donor variation in NK cell or T cell activity, differences in activation protocols, and changes in effector cell phenotype during expansion can all alter killing capacity independently of the experimental variable being tested. Including internal reference standards or benchmark effector populations helps control for this variability.
Additional sources of error that researchers should monitor include:
- Incomplete mixing of co-culture wells before supernatant harvest
- Evaporation from edge wells in multi-well plates during long incubation periods
- Interference of culture media components with colorimetric detection reagents
- Inconsistent cell counting leading to inaccurate E:T ratios at setup
Addressing these sources of error through standardized protocols, automated liquid handling where possible, and rigorous quality controls is essential for generating reliable cell death measurement data in cancer immunotherapy research.
How BioSPX supports cytolysis research in the Benelux
BioSPX supports researchers across Belgium, the Netherlands, and Luxembourg who are working on cytotoxicity assays and cancer cell killing experiments. With an extensive portfolio of instruments suited to cytolysis quantification workflows, BioSPX helps laboratories select and implement the right solutions for their specific research needs.
BioSPX’s offering relevant to cytolysis and cancer research includes:
- Multimode plate readers capable of fluorescence, luminescence, and absorbance detection for LDH and reporter-based assays
- Liquid handling solutions that support consistent and reproducible co-culture setup and supernatant transfer
- Imaging and microscopy systems for live-cell cytolysis monitoring
- Flow cytometry-compatible workflows supported by expert product specialists
- Installation, user training, and after-sales service to ensure instruments perform reliably from day one
BioSPX’s product specialists advise on instrument configurations and experimental setup, helping researchers choose assay formats that match their throughput, sensitivity, and detection requirements. To discuss which instruments best support your cytolysis quantification workflow, contact the BioSPX team directly.
Frequently Asked Questions
Can cytolysis assays be used to evaluate combination immunotherapy treatments, or are they limited to single-effector experiments?
Cytolysis assays can absolutely be adapted to evaluate combination immunotherapy treatments, including combinations of CAR T cells with checkpoint inhibitors, bispecific antibodies, or small-molecule drugs. The key consideration is ensuring that the additional agents do not interfere with the detection method — for example, some small molecules can inhibit LDH activity or quench fluorescent signals, which would artificially skew results. In these cases, luminescence-based viability assays or flow cytometry-based approaches are often more robust choices, as they are less susceptible to chemical interference.
How do I decide between an endpoint assay and a live-cell kinetic assay for my cytolysis experiment?
The choice depends on whether the timing and dynamics of cell killing are relevant to your research question. Endpoint assays such as LDH release or ATP-based luminescence are sufficient when you only need a final lysis percentage at a defined time point, and they are easier to scale and automate. Live-cell kinetic assays, on the other hand, are essential when you need to capture the rate of killing, detect differences in killing speed between effector populations, or observe cytolysis events that peak and then resolve before a fixed endpoint. If your effector cells use slow-acting mechanisms such as TRAIL-mediated apoptosis, a single endpoint measurement may significantly underestimate total cytolytic activity.
What is the best way to handle high spontaneous LDH release that is making my background too elevated to get reliable results?
Start by auditing your target cell culture conditions — spontaneous LDH release above 15–25% of maximum release is typically a sign that cells are stressed, over-passaged, or at excessive density before the assay begins. Reduce passage number, lower seeding density, and confirm viability immediately before co-culture setup using trypan blue or a viability dye. If spontaneous release remains high despite healthy-looking cultures, consider switching to a fluorescence- or luminescence-based assay format, which is generally less sensitive to background leakage than colorimetric LDH detection and offers a wider dynamic range.
Are there cytolysis assay formats that work well with 3D tumor models or spheroids, rather than standard 2D monolayer cultures?
Yes, several assay formats have been adapted for 3D tumor spheroid cytotoxicity models, which are increasingly used in cancer research to better replicate the tumor microenvironment. Luminescence-based cell viability assays that use reagents capable of penetrating spheroid cores are commonly used, and some fluorescent reporter systems can be combined with confocal or light-sheet imaging to visualize killing events spatially within the spheroid. Flow cytometry can also be applied after spheroid dissociation, though this adds a processing step that must be carefully controlled to avoid artificially inflating death measurements. Live-cell imaging platforms are particularly well suited to 3D models because they can track spheroid volume and integrity over time without requiring destructive sample preparation.
How do I normalize cytolysis data when comparing experiments run on different days or with different effector cell donors?
Inter-experiment normalization is one of the most important and underappreciated steps in cytolysis quantification. The most reliable approach is to include a consistent internal reference — for example, a well-characterized effector cell line or a cryopreserved reference donor batch — in every experimental run, and express results relative to that reference. This allows meaningful comparison across days and donors even when absolute lysis values vary. Reporting both raw percentage cytolysis and normalized values in your data, along with clear documentation of effector cell source and activation state, significantly improves the reproducibility and interpretability of results across your research program.
Can I use the same cytolysis assay format to measure both NK cell and CAR T cell killing activity, or do I need different setups for each?
Many cytolysis assay formats are compatible with both NK cell and CAR T cell killing experiments, but the optimal setup parameters will differ between the two. NK cells typically require higher E:T ratios and shorter incubation windows to observe robust killing, while CAR T cells may exhibit potent lysis at lower E:T ratios but over longer timeframes depending on their activation and expansion protocol. If you are running both in parallel, it is advisable to pilot a range of E:T ratios and time points for each effector type before committing to a fixed protocol, and to confirm that your detection format can capture the dynamic range of lysis expected for each.
What should I look for when validating a new cytolysis assay before using it in a full study?
Assay validation for cytolysis quantification should cover at minimum: linearity of the signal across the expected range of lysis values, acceptable spontaneous release from target cells, specificity of the signal to target cell death rather than effector cell contribution, and reproducibility across replicate wells and independent experimental runs. It is also worth confirming that your positive control — typically a well-characterized cytotoxic effector or a chemical lysis control — produces consistent results, and that the assay can discriminate between high- and low-killing conditions with statistical confidence. Documenting these parameters before beginning your study will save significant troubleshooting time and strengthen the credibility of your published data.
Related Articles
- What can spatial data analysis reveal about cellular heterogeneity?
- What are the key differences between spatial proteomics and spatial transcriptomics?
- How can researchers measure real-time changes in cancer cell morphology?
- How can researchers study cancer cell metabolism in the lab?
- How do genetic mutations contribute to cancer development?
This content was generated with the help of AI and it may contain mistakes