
 EN
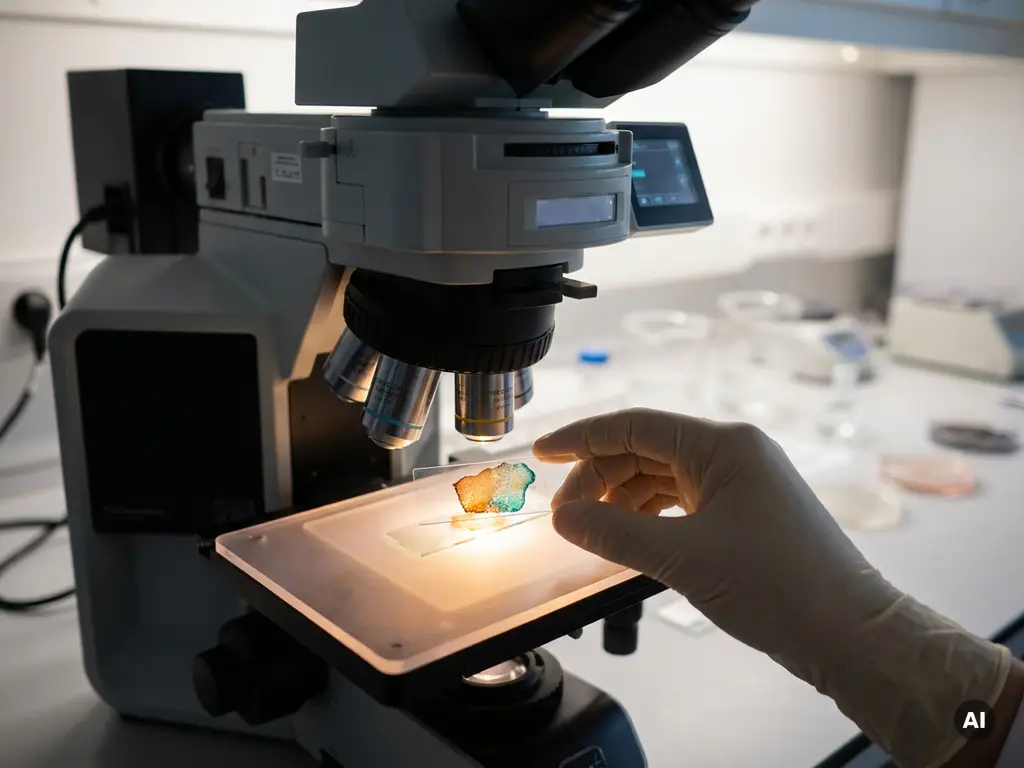
Spatial data analysis reveals cellular heterogeneity by mapping gene expression, protein levels, and other molecular signals directly onto their physical location within a tissue. This means researchers can identify not just which cell types are present, but where they sit, how they cluster, and how their molecular state is shaped by the cells and structures around them. The sections below unpack the key questions driving this field forward.
How does spatial data analysis map gene expression across tissues?
Spatial data analysis maps gene expression by capturing molecular signals, typically RNA transcripts, at defined coordinates within a tissue section, preserving the link between a cell’s identity and its physical location. Unlike dissociation-based methods, spatial transcriptomics retains the architecture of the tissue, allowing researchers to see which genes are active in which regions and how expression gradients form across cell layers or compartments.
In practice, tissue sections are placed onto capture surfaces or probed with spatially barcoded reagents. Each capture spot or pixel records a gene expression profile that can be mapped back to a precise position in the tissue image. The result is a multidimensional dataset that combines histological information with transcriptomic depth, giving researchers a spatially resolved view of gene activity across an entire tissue slice.
This approach has particular value when studying complex tissues such as tumors, brain sections, or developing organoids, where gene expression varies dramatically over short distances. Researchers in the Benelux working in oncology, neuroscience, and developmental biology are increasingly integrating spatial gene expression mapping into their experimental workflows to capture this positional dimension of biology.
What types of cellular heterogeneity can spatial analysis detect?
Spatial analysis can detect several distinct forms of cellular heterogeneity that are invisible to bulk or even single-cell methods performed without positional context. These include transcriptional heterogeneity between neighboring cells, spatial zonation within organs, and microenvironment-driven variation in cell state.
Specifically, spatial omics approaches can identify:
- Cell type diversity: distinguishing between different cell populations co-existing within the same tissue region
- Cell state variation: detecting differences in activation, stress, or differentiation status between cells of the same type depending on their location
- Spatial zonation: identifying gradients of gene expression across tissue layers, such as in the liver or kidney cortex
- Rare cell populations: localizing low-abundance cell types that may be functionally significant but spatially restricted
- Boundary and interface zones: capturing the molecular transitions that occur at the borders between tissue compartments
This level of resolution allows researchers to move beyond asking “which cell types are present?” toward asking “how does a cell’s position within the tissue shape its molecular identity?” That shift in framing has broad implications for how researchers interpret cell population diversity in both healthy and diseased tissues.
How does spatial context change the interpretation of single-cell data?
Spatial context fundamentally changes the interpretation of single-cell data by revealing that cells with similar transcriptional profiles can behave differently depending on where they reside within a tissue. Without positional information, single-cell analysis can identify distinct cell clusters but cannot explain why two cells from the same cluster differ in function or state.
When spatial coordinates are added to single-cell analysis data, researchers can begin to answer questions that dissociation-based workflows cannot address. A macrophage near a tumor core may express a very different set of genes than a macrophage at the tumor margin, even though both appear as the same cluster in a standard single-cell RNA sequencing dataset. Spatial context exposes this hidden layer of variation.
Integrating spatial transcriptomics with single-cell analysis also helps researchers validate cell type annotations. Clusters identified computationally can be checked against their expected anatomical locations, improving confidence in the biological interpretation of the data. For Benelux research groups working with complex tissue models or patient-derived samples, this integration is becoming a key step in ensuring data quality and reproducibility.
What role does the tissue microenvironment play in cellular heterogeneity?
The tissue microenvironment plays a central role in driving cellular heterogeneity by exposing individual cells to different combinations of signals, including paracrine factors, extracellular matrix cues, oxygen gradients, and direct cell-to-cell contacts, that actively shape their molecular state. Cells with identical genomes can adopt very different phenotypes depending on the microenvironmental niche they occupy.
Spatial data analysis is one of the few methodologies that can directly capture this relationship. By overlaying gene expression data onto tissue architecture, researchers can identify which signaling pathways are active in cells located near specific structures such as blood vessels, stromal boundaries, or immune infiltrates. This reveals how the local environment contributes to cell population diversity in ways that bulk sequencing or dissociation-based single-cell methods cannot.
In oncology research, for example, the tumor microenvironment is a major focus of spatial omics studies. Researchers are investigating how immune cells, cancer-associated fibroblasts, and tumor cells interact spatially, and how these interactions may influence the molecular state of each population. Understanding these relationships at the tissue level is a key goal for research groups across Belgium, the Netherlands, and Luxembourg working in translational and basic cancer biology.
Which spatial analysis tools and platforms are used in research today?
Researchers today use a range of spatial analysis platforms that differ in their resolution, throughput, and the type of molecular information they capture. The choice of platform depends on the biological question, the tissue type, and the level of spatial resolution required.
Current approaches broadly fall into the following categories:
- Capture-based spatial transcriptomics: tissue sections are placed onto barcoded surfaces that capture RNA at defined grid positions, providing whole-transcriptome coverage across a tissue slice at near-cellular or subcellular resolution
- In situ sequencing and hybridization methods: RNA molecules are detected and sequenced directly within intact tissue sections, preserving single-cell and subcellular spatial resolution
- Multiplexed imaging platforms: fluorescence or mass spectrometry-based imaging methods that detect dozens to hundreds of proteins or RNA targets simultaneously within a tissue section
- Spatial proteomics approaches: methods that map protein abundance and localization across tissues, complementing transcriptomic spatial data
Computational tools for processing and integrating spatial omics data are also advancing rapidly, with dedicated software ecosystems emerging to handle the unique data structures that spatial datasets produce. For research laboratories in the Benelux, access to cellular analysis systems that support these workflows is an important consideration when designing spatial biology studies.
Where is spatial heterogeneity analysis making the biggest impact?
Spatial heterogeneity analysis is currently making the biggest impact in cancer biology, neuroscience, developmental biology, and immunology, fields where the spatial organization of cells within a tissue is directly relevant to understanding biological function and disease mechanisms.
In cancer research, spatial omics is helping researchers characterize the tumor microenvironment with unprecedented detail, revealing how different cell populations are organized within tumors and how that organization may relate to disease progression. In neuroscience, spatial transcriptomics is being used to map cell type diversity across brain regions, uncovering the molecular basis of regional specialization. In developmental biology, spatial methods are providing insight into how tissues and organs form by tracking gene expression gradients across space and time.
Immunology is another area where spatial analysis is proving particularly valuable. Understanding where immune cells localize within tissues, and how their gene expression is shaped by that location, is a key research question for groups studying inflammation, autoimmunity, and host-pathogen interactions. Benelux academic and biotech research groups are active contributors to these areas, and the adoption of spatial omics tools in the region is growing steadily as the technology becomes more accessible and the analytical frameworks more mature.
How BioSPX supports spatial and cellular analysis research
BioSPX supports research teams in Belgium, the Netherlands, and Luxembourg who are working with advanced cellular and spatial analysis workflows. Whether a laboratory is building its first spatial biology pipeline or scaling an established cellular analysis workflow, BioSPX offers:
- An extensive portfolio of instruments relevant to cellular and spatial biology, including imaging systems, multimode readers, and liquid handling solutions
- Expert guidance from product specialists who advise on instrument selection, experimental setup, and system configuration
- Installation, user training, and responsive maintenance support from a dedicated service team
- ISO 9001-certified processes ensuring consistent quality in pre- and post-sales support
For research organizations in the Benelux looking to strengthen their capabilities in single-cell analysis, spatial transcriptomics, or tissue imaging, BioSPX provides the instruments and expertise to move those workflows forward. Get in touch with BioSPX to discuss your laboratory’s specific needs and explore the right solutions for your research goals.
Frequently Asked Questions
How do I decide which spatial omics platform is right for my research question?
The best starting point is to define your primary biological question and the resolution it requires. If you need whole-transcriptome coverage across a large tissue area, capture-based platforms are a strong fit; if single-cell or subcellular resolution is critical, in situ sequencing or multiplexed imaging methods may be more appropriate. It is also worth considering your tissue type, sample throughput, and whether you need to co-detect proteins alongside RNA, as some platforms support multi-modal readouts while others are specialized for a single molecular layer. Consulting with a platform specialist before committing to a workflow can save significant time and resources.
What are the most common mistakes researchers make when starting a spatial transcriptomics experiment?
One of the most frequent pitfalls is poor tissue quality going into the experiment — RNA degradation during sectioning, fixation, or storage can dramatically reduce data quality, so optimizing tissue handling protocols before running a full experiment is essential. Another common mistake is underestimating the computational demands of spatial datasets; unlike standard single-cell data, spatial omics outputs require specialized pipelines for alignment, spot deconvolution, and spatial statistics, so having a bioinformatics plan in place before data generation is strongly recommended. Finally, researchers sometimes neglect to include appropriate biological replicates, which limits the statistical power needed to draw confident conclusions from spatially resolved data.
Can spatial omics methods be applied to archived or FFPE tissue samples?
Yes, several spatial transcriptomics and multiplexed imaging platforms have been specifically adapted for formalin-fixed, paraffin-embedded (FFPE) tissue, which is the standard format for clinical and biobank archives. This compatibility has significantly expanded access to retrospective cohorts and patient-derived samples, making spatial omics increasingly relevant for translational research. However, RNA yield and quality from FFPE material are generally lower than from fresh-frozen tissue, so protocol optimization — including deparaffinization and antigen retrieval steps — is important for maximizing data quality.
How can spatial data be integrated with existing single-cell RNA sequencing datasets?
A common integration strategy is to use the single-cell dataset as a reference to deconvolve or annotate the lower-resolution spatial spots, assigning cell type compositions to each capture location based on transcriptional similarity. Tools such as Seurat, Squidpy, cell2location, and RCTD are widely used for this purpose and can map single-cell-derived cell type labels onto spatial coordinates. The integration works best when the single-cell and spatial datasets are derived from the same tissue type or experimental condition, minimizing batch effects and improving the accuracy of cell type predictions across the tissue map.
What sample size or number of tissue sections is typically needed for a statistically robust spatial omics study?
There is no universal rule, but spatial omics studies generally require a minimum of three biological replicates per condition to support meaningful statistical comparisons, with more replicates improving robustness — particularly when studying heterogeneous samples such as patient tumors. The number of tissue sections per sample depends on the tissue’s size and complexity; for large or architecturally variable tissues, multiple sections at different depths or orientations can be necessary to capture representative spatial variation. Discussing your experimental design with a biostatistician or spatial biology specialist before starting is a practical way to ensure your study is adequately powered.
Is spatial omics analysis feasible for smaller research labs with limited budgets, or is it mainly accessible to large core facilities?
Spatial omics has historically been associated with high per-sample costs and specialized infrastructure, but the landscape is changing rapidly as platforms become more competitive in pricing and more accessible in format. Smaller labs often gain access through institutional core facilities, collaborative agreements with larger centers, or by starting with targeted multiplexed imaging approaches, which can be more cost-effective than whole-transcriptome spatial sequencing for specific research questions. BioSPX works with research groups across the Benelux at different scales and can help identify instrument and workflow configurations that align with both scientific goals and budget constraints.
What computational skills or infrastructure does a lab need to analyze spatial omics data in-house?
At a minimum, in-house spatial data analysis requires familiarity with Python or R, as the leading spatial omics toolkits — including Seurat, Squidpy, Giotto, and STUtility — are built on these languages. Access to sufficient computing resources is also important, since spatial datasets can be large and memory-intensive, particularly when integrating high-resolution imaging data with transcriptomic readouts; cloud computing or institutional HPC clusters are common solutions for labs without dedicated servers. For teams new to spatial bioinformatics, starting with well-documented tutorials and community resources from platforms like Bioconductor or the Scverse ecosystem is a practical way to build analytical capability progressively.
Related Articles
- How does angiogenesis support tumor growth at the cellular level?
- How can flow cytometry complement live-cell imaging in treatment response studies?
- What causes cancer cells to behave differently across repeated experiments?
- What should researchers consider when designing long-term cancer cell experiments?
- What can continuous cell monitoring reveal that endpoint assays cannot?
This content was generated with the help of AI and it may contain mistakes