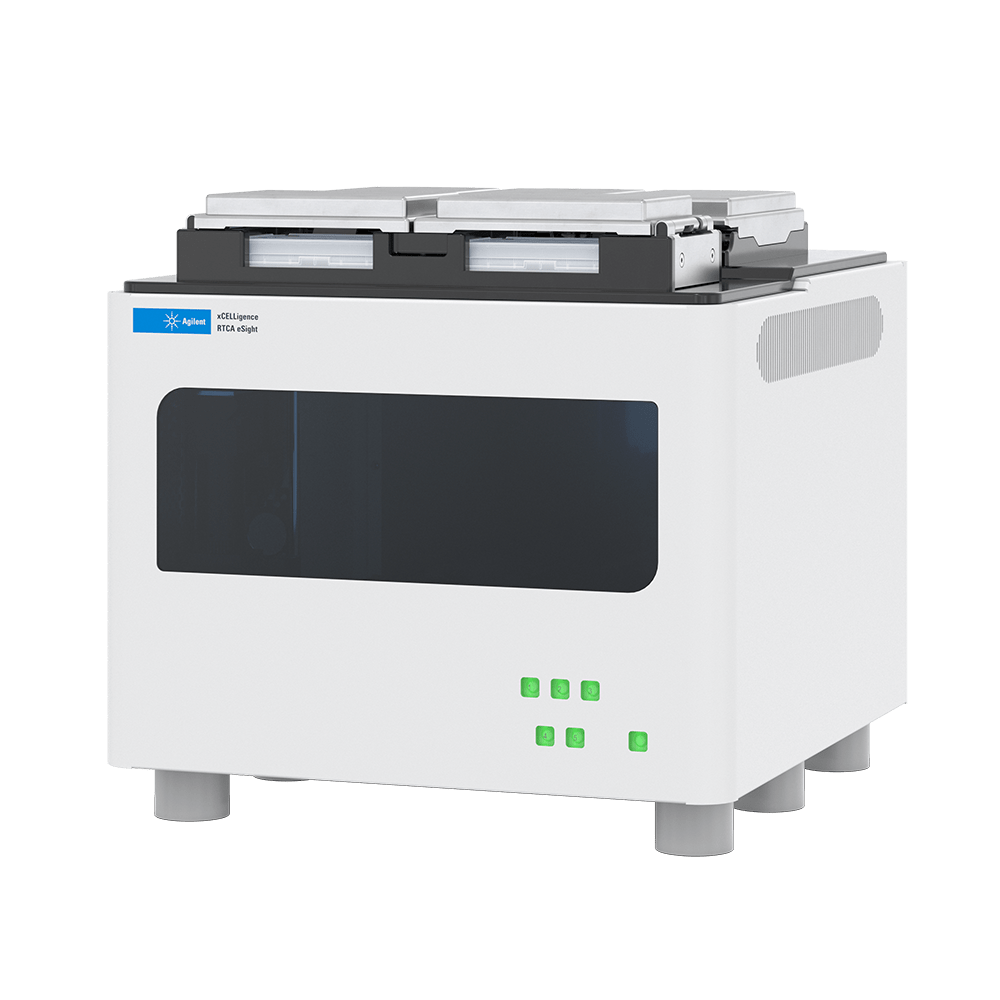
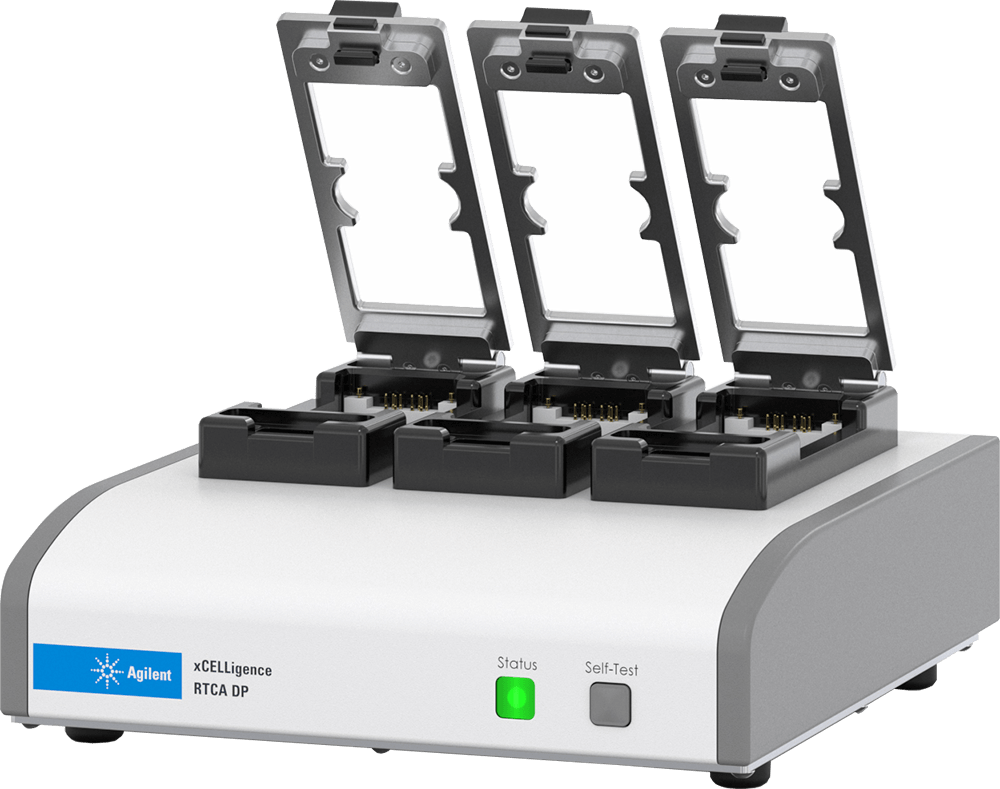
Impedance-based real-time cell analysis monitors changes in the electrical response of cells interacting with electrodes. In Agilent xCELLigence systems, integrated microelectrodes provide a label-free, kinetic readout sensitive to cell attachment, morphology and cell number. Measurements follow the same culture over time, helping researchers identify response onset and duration. [1,2]
How cellular impedance is measured
A small alternating electrical signal is applied across electrodes in specialised culture plates. Cells attaching and spreading over the electrode surface change the measured impedance. xCELLigence software reports a derived, dimensionless parameter called Cell Index. Its value reflects the integrated effects of cell coverage, attachment and morphology under the assay conditions. It is not a direct electrical count of individual cells. [2]
Applications for kinetic cell assays
RTCA is used to study proliferation, adhesion, compound responses and cell-mediated cytotoxicity. Repeated measurements can distinguish rapid responses from delayed effects and reveal transient changes that endpoint assays may miss. Biological interpretation still depends on the experimental model. An early attachment response and a later proliferation response can influence different parts of the same trace. [1,3]
Interpreting changes in Cell Index
A falling Cell Index can reflect cell detachment, altered spreading, loss of viability or a combination of effects. An increase can also arise from changes in morphology or attachment. Published experiments demonstrate that cells at the same number can produce different impedance signals when their morphology changes. [3] Use imaging, viability markers or other suitable endpoints to establish the mechanism relevant to the experiment. Normalised Cell Index expresses change relative to a selected time point; it does not remove every biological or technical confounder.
Real-time impedance traces explained
Correlating impedance with cellular phenomena
The impedance of electron flow caused by adherent cells is reported using a unitless parameter called Cell Index (CI), where CI = (impedance at time point n – impedance in the absence of cells)/nominal impedance value. Figure 3 provides a generic example of a real-time impedance trace throughout the course of setting up and running an apoptosis experiment. For the first few hours after cells have been added to a well there is a rapid increase in impedance. This is caused by cells falling out of suspension, depositing onto the electrodes, and forming focal adhesions. If the initial number of added cells is low and there is empty space on the well bottom cells will proliferate, causing a gradual yet steady increase in CI. When cells reach confluence the CI value plateaus, reflecting the fact that the electrode surface area that is accessible to bulk media is no longer changing. The addition of an apoptosis inducer at this point causes a decrease in CI back down to zero. This is the result of cells rounding and then detaching from the well bottom. While this generic example involves drug addition when cells are confluent, impedance-based assays are extremely flexible and can also evaluate the rate and extent of initial cell adhesion to the electrodes, or the rate and extent of cell proliferation.
RTCA provides a quantitative readout of cell number, proliferation rate, cell size/shape, and cell-substrate attachment quality. Because these physical properties are the product of thousands of different genes/proteins, RTCA can provide an extremely wide field of view on cell health and behavior. Everything from endothelial barrier function and chemotaxis to filopodia dynamics and immune cell-mediated cytolysis have successfully been analyzed on xCELLigence instruments. Despite the breadth of their reach, xCELLigence assays are still capable of interrogating very specific biochemical and cellular phenomena. Appropriate use of controls and/or orthogonal techniques make it possible to correlate the features of an impedance trace with specific cellular/molecular phenomena. To learn more about how this is done, and to witness the sensitivity and versatility of the xCELLigence RTCA technology, peruse the many specific applications that are highlighted here.
BioSPX lists S16, SP, MP, DP, HT and eSight platforms. RTCA DP supports migration and invasion measurements using dedicated CIM-Plates. RTCA eSight combines impedance with fluorescence and brightfield imaging, which can provide complementary visual information. These capabilities are model-specific.
BioSPX helps researchers in the Benelux with all their questions.
Does RTCA measure cell death directly?
Impedance can reveal changes consistent with cytotoxicity, but a trace alone does not identify the underlying mechanism. Use a validated assay design and confirmatory endpoints where needed.
Can Cell Index be converted into cell number?
Only through an assay-specific calibration under conditions where attachment and morphology remain sufficiently consistent. A universal conversion is inappropriate.
Manage Consent
To provide the best experiences, we use technologies like cookies to store and/or access device information. Consenting to these technologies will allow us to process data such as browsing behavior or unique IDs on this site. Not consenting or withdrawing consent, may adversely affect certain features and functions.
Functional
Always active
The technical storage or access is strictly necessary for the legitimate purpose of enabling the use of a specific service explicitly requested by the subscriber or user, or for the sole purpose of carrying out the transmission of a communication over an electronic communications network.
Preferences
The technical storage or access is necessary for the legitimate purpose of storing preferences that are not requested by the subscriber or user.
Statistics
The technical storage or access that is used exclusively for statistical purposes.The technical storage or access that is used exclusively for anonymous statistical purposes. Without a subpoena, voluntary compliance on the part of your Internet Service Provider, or additional records from a third party, information stored or retrieved for this purpose alone cannot usually be used to identify you.
Marketing
The technical storage or access is required to create user profiles to send advertising, or to track the user on a website or across several websites for similar marketing purposes.

 EN
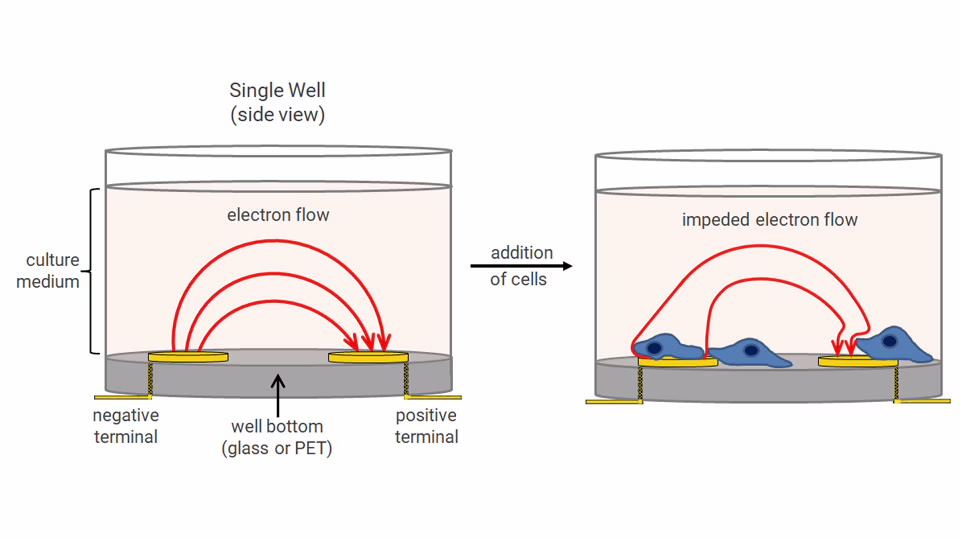

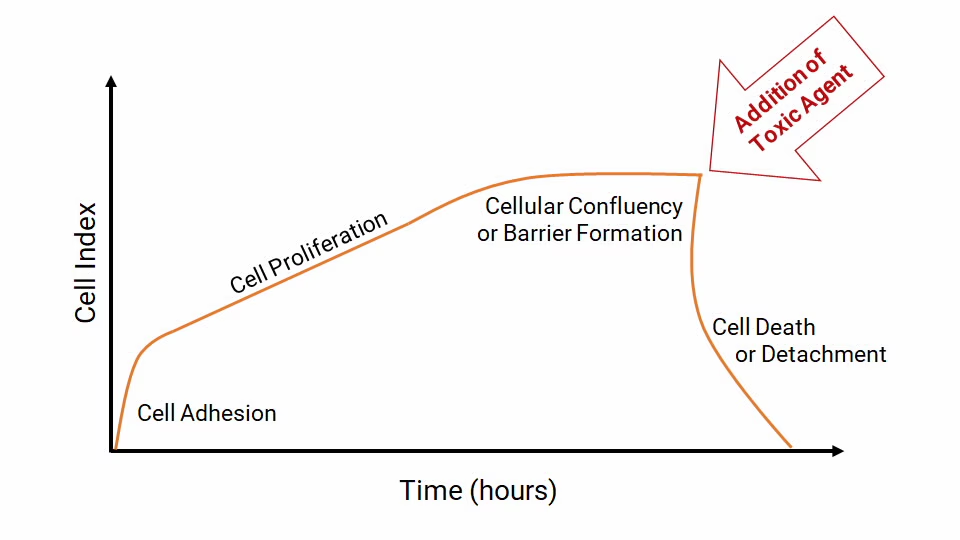 Fig: Generic real-time impedance trace for setting up and running an apoptosis assay. Each phase of the impedance trace, and the cellular behavior it arises from, is explained in the text.
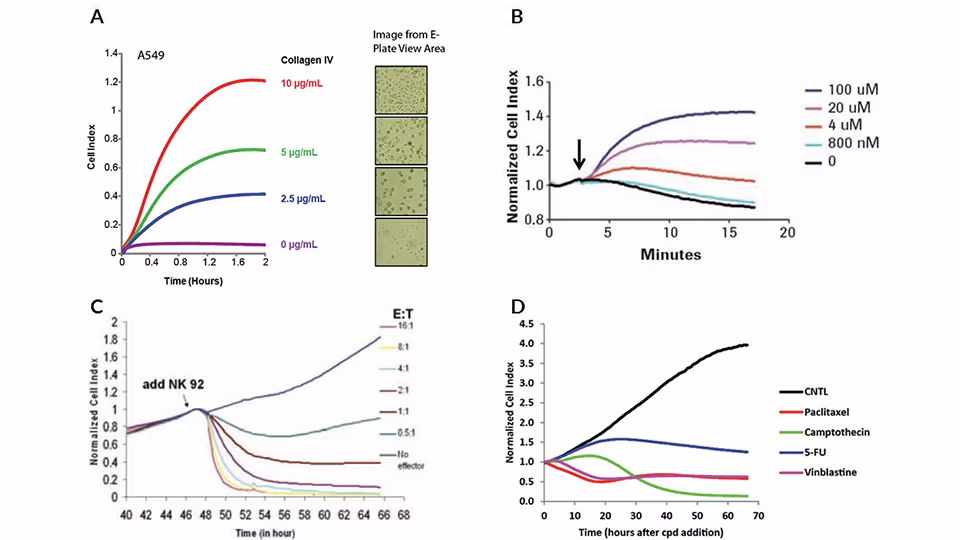 Fig: Examples of real-time impedance traces obtained using E-Plates and xCELLigence RTCA instruments. (A) Real-time monitoring of A549 cell adhesion to E-Plate wells that had been pre-coated with different concentrations of collagen IV. Note the correlation between impedance values (Cell Index) and the number of adherent cells visible in the microscope. (B) Real-time impedance traces for HeLa cells exposed to different concentrations of the GPCR agonist dopamine. The black arrow indicates the time of dopamine addition. (C) Real-time impedance traces for NK 92 cell-mediated cytolysis of MCF7 breast cancer cells. (D) Real-time impedance traces for A549 cells exposed to drugs displaying a variety of mechanisms of action.