
 EN
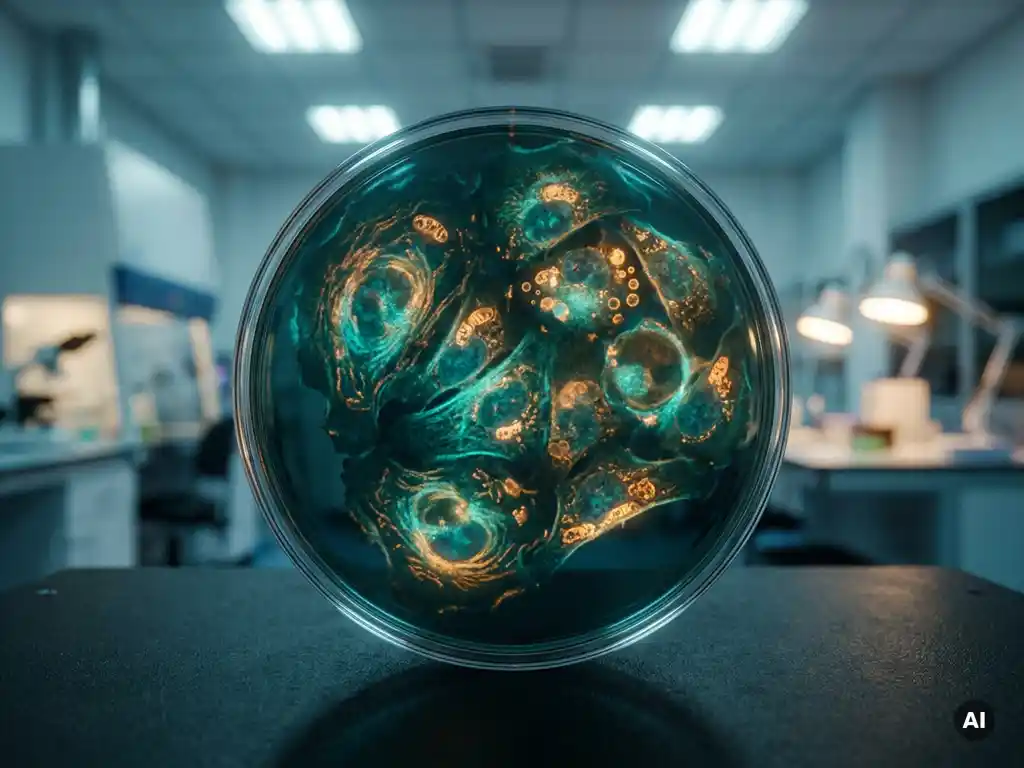
FLIM-FRET preserves spatial information that bulk assays lose by encoding molecular interaction data as fluorescence lifetime maps, where every pixel in an image carries its own lifetime value reflecting local FRET efficiency. Because lifetime is an intrinsic property of the fluorophore rather than a function of signal intensity, FLIM-FRET separates interacting from non-interacting populations within a single cell, organelle, or tissue region. The sections below unpack the key questions researchers ask when evaluating this technique.
Why do bulk FRET measurements lose spatial context?
Bulk FRET measurements average fluorescence signals across an entire sample population, collapsing all spatial heterogeneity into a single number. When millions of cells are measured together, the resulting FRET efficiency value reflects the mean behavior of the population, not the local molecular environment of any individual cell, compartment, or signaling domain. Rare events, subcellular gradients, and spatially restricted interactions are invisible in this averaged readout.
This loss of context matters because many biological processes are inherently spatial. Protein complex formation may occur preferentially at the plasma membrane, in perinuclear regions, or within specific organelles. A bulk assay cannot distinguish whether 10% FRET efficiency arises from 10% of molecules interacting strongly everywhere, or from 100% of molecules interacting weakly in one restricted zone. The two scenarios have entirely different biological meanings, yet they produce identical bulk readouts.
Intensity-based FRET performed on a microscope partially addresses this by producing images, but it remains vulnerable to artifacts from spectral bleedthrough, direct acceptor excitation, and variations in fluorophore concentration across the field of view. These confounds make it difficult to extract reliable, quantitative FRET efficiency values at the pixel level without extensive correction procedures.
How does FLIM encode molecular interactions as lifetime maps?
Fluorescence lifetime imaging microscopy measures how long a fluorophore remains in its excited state before emitting a photon. In a FLIM-FRET experiment, energy transfer from the donor fluorophore to an acceptor provides an additional de-excitation pathway, shortening the donor’s lifetime in proportion to the FRET efficiency. The result is a pixel-by-pixel map where shorter lifetimes indicate regions of active molecular interaction.
Because lifetime is measured in the time domain rather than as an intensity ratio, it is largely independent of fluorophore concentration, excitation power, and photobleaching. This makes lifetime values directly comparable across different cells, imaging sessions, and laboratories, which is a significant advantage for reproducibility in quantitative research workflows.
In practice, FLIM data are typically acquired using time-correlated single-photon counting or time-gated detection. The decay curve at each pixel is fitted to a single- or multi-exponential model, and the resulting lifetime components are displayed as a false-color map. Regions where the donor lifetime is shortened can be attributed to FRET, and from the degree of shortening, researchers can calculate local FRET efficiency with quantitative precision.
What spatial information can FLIM-FRET reveal that intensity-based FRET cannot?
FLIM-FRET can resolve molecular interactions at the level of individual subcellular compartments, membrane microdomains, and even single cells within a heterogeneous population. Intensity-based FRET methods struggle to achieve this level of spatial precision because the signal depends on local fluorophore concentration, which varies across a cell and is difficult to normalize without introducing additional assumptions.
Specific spatial insights that FLIM-FRET can provide include:
- The distribution of protein complex formation across distinct organelles such as the endoplasmic reticulum, mitochondria, or nucleus
- Differences in interaction stoichiometry between the cell periphery and the perinuclear region
- Transient, spatially restricted signaling events at the plasma membrane that are averaged away in bulk measurements
- Cell-to-cell variability in interaction frequency within a clonal population
- The progression of molecular interactions through time and space during dynamic processes such as receptor activation or cell division
This spatial resolution transforms FRET from a population-level assay into a tool for mapping the molecular geography of living cells.
Which biological questions are uniquely suited to FLIM-FRET?
FLIM-FRET is particularly well matched to biological questions where the location or local context of a molecular interaction is as important as the interaction itself. Questions that depend on knowing where within a cell or tissue a process occurs are strong candidates for this technique.
Research areas where FLIM-FRET has demonstrated clear advantages include:
- Receptor dimerization and clustering: Mapping where receptor complexes form at the plasma membrane in response to ligand stimulation
- Transcription factor interactions: Identifying nuclear subdomains where regulatory proteins co-occupy chromatin
- Apoptosis signaling: Tracking the spatial propagation of caspase activation through a cell population
- Cytoskeletal dynamics: Monitoring protein conformational changes in actin or tubulin networks during cell migration
- Biosensor readouts: Quantifying second messenger concentrations such as calcium or cAMP in specific subcellular zones
In each case, the spatial map provided by FLIM-FRET adds interpretive depth that a plate reader or flow cytometry assay simply cannot supply.
How does FLIM-FRET perform in thick samples and 3D models?
FLIM-FRET can be applied to thick samples and three-dimensional tissue models, though performance depends on the optical configuration used. When combined with confocal or multiphoton excitation, FLIM provides optically sectioned lifetime maps through tissue volumes, enabling researchers to study molecular interactions at defined depths rather than only at the surface of a sample.
Multiphoton FLIM-FRET is especially relevant for organoid research and ex vivo tissue preparations, where imaging depth and reduced phototoxicity are both priorities. The longer excitation wavelengths used in multiphoton microscopy scatter less in biological tissue, allowing lifetime measurements to be collected from tens to hundreds of micrometers below the sample surface without significant degradation of signal quality.
For researchers working with organoids, spheroids, or tissue sections in Benelux laboratories, this capability is increasingly important as three-dimensional cell culture models become standard tools in drug discovery and disease modeling workflows. The ability to map protein interactions within an intact 3D architecture, rather than dissociating the model into a single-cell suspension for a bulk assay, preserves the spatial relationships that give these models their biological relevance.
What instrumentation does a FLIM-FRET experiment require?
A FLIM-FRET experiment requires a fluorescence microscope equipped with a pulsed or modulated light source, a time-resolved detection system, and software capable of fitting fluorescence decay curves at the pixel level. The core hardware components distinguish FLIM from standard confocal or widefield imaging.
Key instrumentation elements include a pulsed laser or LED source with a repetition rate matched to the donor fluorophore’s lifetime, a single-photon-sensitive detector such as a photomultiplier tube or single-photon avalanche diode, and a timing electronics module for time-correlated single-photon counting. Frequency-domain FLIM systems offer an alternative approach using modulated light sources and phase-sensitive detection, which can be faster for certain applications.
Choosing the right system depends on the fluorophores involved, the required spatial resolution, whether the sample is a live cell or fixed tissue, and whether single-plane or volumetric imaging is needed. Researchers planning to implement FLIM-FRET for the first time benefit from expert guidance during instrument selection, since the combination of detector sensitivity, time resolution, and acquisition speed must be matched to the biological timescales of the interactions being studied.
How BioSPX supports FLIM-FRET and advanced fluorescence imaging
BioSPX supports researchers in the Benelux region who are building or expanding their fluorescence imaging capabilities, including those moving toward quantitative techniques such as FLIM-FRET. As a specialist distributor of life science instruments, BioSPX offers:
- Expert advice on instrument selection matched to specific research questions and sample types
- Access to advanced cellular analysis systems suited to live-cell and 3D model imaging workflows
- Installation, user training, and application support from product specialists with hands-on knowledge of system configuration
- Ongoing maintenance and rapid service response to protect instrument uptime and data quality
- Pre- and post-sales guidance to help laboratories make informed decisions for current and future research needs
Whether you are evaluating imaging platforms for the first time or looking to expand an existing setup, the BioSPX team can help you identify the right solution for your laboratory. Contact BioSPX to discuss your imaging requirements with a specialist.
Frequently Asked Questions
What fluorophore pairs work best for FLIM-FRET experiments?
The most commonly used donor-acceptor pairs for FLIM-FRET include CFP-YFP, GFP-mCherry, and Alexa Fluor 488-Alexa Fluor 555, with the donor fluorophore’s lifetime being the critical parameter to optimize. An ideal donor has a long, monoexponential lifetime in the absence of FRET, which makes it easier to detect the lifetime shortening caused by energy transfer. Avoid fluorophores with intrinsically complex multi-exponential decays, as these complicate data fitting and reduce the sensitivity with which you can detect FRET-induced lifetime changes.
How many photons per pixel do I need to collect for reliable FLIM-FRET data?
As a general rule, a minimum of 100–500 photons per pixel is required to fit a single-exponential decay with reasonable statistical confidence, while resolving two lifetime components in a mixed interacting and non-interacting population typically demands 1,000 photons or more per pixel. Collecting too few photons is one of the most common sources of noisy or unreliable FLIM-FRET maps, particularly in live-cell experiments where acquisition time is limited by phototoxicity. Binning adjacent pixels spatially is a practical way to increase photon counts when signal is low, though this comes at the cost of spatial resolution.
What controls are essential for a well-designed FLIM-FRET experiment?
At minimum, every FLIM-FRET experiment should include a donor-only control to establish the unquenched donor lifetime baseline, and a positive FRET control using a directly fused donor-acceptor construct to confirm the system can detect lifetime shortening. A negative FRET control, such as co-expressing the donor and acceptor on proteins known not to interact, helps verify that any observed lifetime shortening reflects genuine molecular proximity rather than spectral artifacts or non-specific crowding. These controls should be imaged under identical acquisition conditions and used to anchor the interpretation of lifetime values across all experimental samples.
Can FLIM-FRET be used for live-cell imaging, and what are the main challenges?
Yes, FLIM-FRET is fully compatible with live-cell imaging and is one of its most powerful applications, enabling researchers to track the spatiotemporal dynamics of molecular interactions in real time. The main challenges are acquisition speed and phototoxicity: time-correlated single-photon counting systems require sufficient photon collection time to build decay curves at each pixel, which can limit temporal resolution for fast biological events. Using brighter fluorophores, optimizing laser power to minimize phototoxicity, and selecting faster detection modalities such as frequency-domain FLIM or time-gated widefield systems can help balance image quality with cell viability during long time-lapse experiments.
How do I interpret a FLIM-FRET lifetime map — what do the colors actually mean?
In a false-color FLIM lifetime map, each color represents a range of fluorescence lifetime values at that pixel, with the color scale typically running from short lifetimes (often displayed in red or warm tones) to long lifetimes (displayed in blue or cool tones), though this convention varies by software. Pixels displaying a shorter donor lifetime relative to the donor-only baseline indicate regions where FRET is occurring, meaning the labeled molecules are in close proximity (generally within 1–10 nm). The degree of lifetime shortening can be converted into a quantitative FRET efficiency value using the formula E = 1 − (τDA / τD), where τDA is the donor lifetime in the presence of the acceptor and τD is the donor-only lifetime.
What are the most common mistakes researchers make when setting up FLIM-FRET for the first time?
The most frequent pitfalls include choosing a donor fluorophore with a multi-exponential or environmentally sensitive lifetime, underestimating the photon counts needed for robust curve fitting, and skipping essential controls that anchor the interpretation of lifetime data. Another common mistake is failing to validate that the observed lifetime shortening is FRET-specific by testing whether it disappears when the acceptor is absent or when the protein-protein interaction is pharmacologically disrupted. Working with an applications specialist during initial setup — rather than troubleshooting independently after data collection — saves considerable time and helps avoid systematic errors that can compromise an entire dataset.
Is FLIM-FRET compatible with super-resolution microscopy techniques?
FLIM-FRET can be combined with certain super-resolution approaches, most notably STED (stimulated emission depletion) microscopy, which has been demonstrated to provide sub-diffraction lifetime maps with spatial resolution below 100 nm. This combination, sometimes called STED-FLIM, is particularly valuable for resolving molecular interactions within nanoscale structures such as synaptic densities, membrane nanodomains, or chromatin loops that are below the diffraction limit of conventional confocal imaging. However, STED-FLIM systems are technically demanding and require careful optimization of depletion laser power to avoid artifacts in the measured lifetime values, so it is advisable to establish a robust standard FLIM-FRET workflow before moving to super-resolution implementations.
Related Articles
- How can researchers combine tissue mapping with molecular interaction measurements?
- How do cancer cells differ from normal healthy cells?
- What is the difference between apoptosis and necrosis in cancer cells?
- How does radiation therapy work in cancer treatment?
- How does cancer affect the immune system?
This content was generated with the help of AI and it may contain mistakes