
 EN
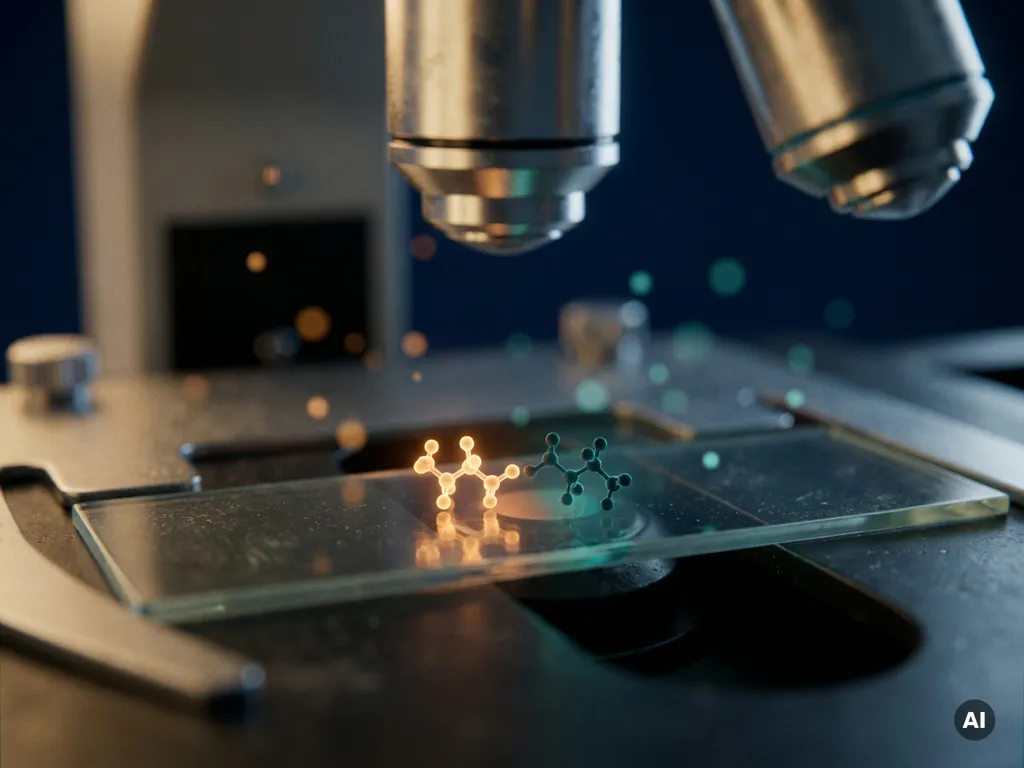
Förster resonance energy transfer, commonly known as FRET, measures molecular proximity at the nanometer scale by detecting the non-radiative transfer of energy between two fluorophores positioned within roughly 1 to 10 nanometers of each other. Because FRET efficiency falls off steeply with distance, it functions as a molecular ruler that operates far below the resolution limit of conventional fluorescence microscopy, which typically cannot distinguish structures separated by less than 200 nanometers. The sections below unpack how this mechanism works, how researchers measure it, and what biological questions it can uniquely address.
What makes FRET sensitive to distances below 10 nanometers?
FRET is sensitive to distances below 10 nanometers because its efficiency is inversely proportional to the sixth power of the distance between two fluorophores. This extreme distance dependence means that even a small change in molecular separation produces a large, measurable change in energy transfer, giving researchers a readout that reflects molecular proximity with far greater precision than the diffraction limit of light allows.
Conventional fluorescence microscopy is constrained by the diffraction limit, meaning two structures closer than roughly 200 to 250 nanometers cannot be resolved as distinct objects. FRET sidesteps this constraint entirely. Rather than relying on resolving two separate signals spatially, it reports on the physical distance between fluorophore-labeled molecules through changes in fluorescence intensity or lifetime. The technique is therefore sensitive to interactions at the scale of individual protein domains, receptor-ligand complexes, and conformational changes within a single macromolecule.
The characteristic distance at which FRET efficiency drops to 50 percent is called the Förster radius, typically denoted R0. For most commonly used fluorophore pairs, R0 falls between 2 and 9 nanometers, which coincides precisely with the dimensions of proteins, nucleic acids, and other biomolecules. This physical coincidence is what makes FRET such a powerful tool for studying molecular architecture in living cells.
How does FRET actually transfer energy between fluorophores?
FRET transfers energy through a non-radiative dipole-dipole coupling mechanism between a donor fluorophore and an acceptor fluorophore. When the donor is excited by light, instead of emitting a photon, it transfers its excited-state energy directly to the acceptor through resonance coupling, causing the acceptor to emit fluorescence. No photon is exchanged in this process, which distinguishes FRET from simple light re-absorption.
For this energy transfer to occur, three conditions must be met simultaneously. First, the emission spectrum of the donor must overlap substantially with the excitation spectrum of the acceptor, a parameter known as spectral overlap. Second, the two fluorophores must be positioned within the effective FRET range, generally no more than 10 nanometers apart. Third, the transition dipole moments of the donor and acceptor must not be oriented perpendicularly to each other, as orientation affects coupling efficiency.
When FRET occurs, the donor signal decreases while the acceptor signal increases, a phenomenon called sensitized emission. The ratio of these signals, or the change in donor fluorescence lifetime, provides a quantitative measure of FRET efficiency. This efficiency directly reflects the average distance between the labeled molecules in the sample.
What are the main FRET measurement methods in microscopy?
The main FRET measurement methods in microscopy are sensitized emission, acceptor photobleaching, and fluorescence lifetime imaging microscopy, known as FLIM-FRET. Each approach extracts FRET efficiency from a different optical readout, and researchers choose between them based on the biological question, the imaging system available, and the required quantitative precision.
- Sensitized emission: Measures the increase in acceptor fluorescence upon donor excitation. It is straightforward to implement on standard widefield or confocal systems but requires careful correction for spectral bleed-through and direct acceptor excitation.
- Acceptor photobleaching: Irreversibly destroys the acceptor fluorophore and measures the resulting increase in donor fluorescence. Because FRET suppresses donor emission, removing the acceptor reveals how much suppression was occurring. This method is robust and internally controlled but cannot be used in live, dynamic experiments.
- FLIM-FRET: Measures the reduction in donor fluorescence lifetime caused by FRET. Because lifetime is independent of fluorophore concentration and excitation intensity, FLIM-FRET provides highly quantitative and reproducible data. It is particularly well suited to live-cell imaging where dynamic protein interactions need to be tracked over time.
FLIM-FRET has gained considerable traction in Benelux research laboratories because it offers robust quantification even in samples where fluorophore concentration varies across the field of view, a common challenge in cell biology experiments.
Which fluorophore pairs work best for FRET experiments?
The most effective fluorophore pairs for FRET experiments combine a bright, photostable donor with an acceptor whose excitation spectrum closely overlaps the donor’s emission spectrum. The spectral overlap integral, quantum yield, and extinction coefficient all influence how efficiently energy transfer occurs and how clearly the FRET signal can be distinguished from background.
Genetically encoded fluorescent protein pairs are widely used in live-cell FRET studies. The combination of a cyan fluorescent protein as donor and a yellow fluorescent protein as acceptor remains a well-established choice for intracellular biosensors, particularly in studies of signaling dynamics. Green and red fluorescent protein combinations offer a larger spectral separation, which reduces bleed-through artifacts and is advantageous when multiplexing with other fluorescent markers.
For fixed-cell or in vitro experiments, synthetic organic dyes generally outperform fluorescent proteins in terms of brightness and photostability. Paired dyes with well-characterized Förster radii allow researchers to calculate absolute distances rather than relative changes, which is essential when FRET is used as a structural biology tool rather than a simple interaction reporter.
Regardless of the pair chosen, researchers should validate spectral overlap, confirm the absence of direct acceptor excitation at the donor wavelength, and account for the orientation factor in their experimental design.
What biological questions can FRET answer that conventional microscopy cannot?
FRET can answer biological questions about molecular interactions, conformational changes, and signaling events that occur at length scales below the resolution limit of conventional fluorescence microscopy. Because it reports on distances of 1 to 10 nanometers, FRET provides direct evidence of whether two labeled molecules are physically close enough to interact, something that co-localization in a widefield image cannot confirm.
Specific biological questions that FRET is well positioned to address include:
- Protein-protein interactions: FRET can confirm direct binding between two proteins inside a living cell, distinguishing genuine complexes from coincidental co-localization within the same diffraction-limited spot.
- Receptor activation and conformational change: Fluorescent biosensors based on FRET can report on the open or closed state of ion channels, the activation of G-protein-coupled receptors, or the unfolding of signaling proteins in real time.
- Intracellular signaling dynamics: FRET-based biosensors for second messengers such as cyclic AMP or calcium allow researchers to map where and when signaling events occur within a single cell, with subcellular spatial resolution.
- Nucleic acid structure and hybridization: In molecular biology, FRET reports on DNA or RNA folding, strand separation, and hybridization at the single-molecule level.
- Membrane organization: FRET can probe lipid raft formation and receptor clustering in the plasma membrane, questions that are inaccessible to conventional imaging approaches.
What are the most common sources of error in FRET measurements?
The most common sources of error in FRET measurements are spectral bleed-through, incomplete labeling, fluorophore photobleaching, and the orientation factor. Each of these can produce artifactual changes in the apparent FRET signal that are unrelated to actual changes in molecular proximity, leading to incorrect conclusions about protein interactions or distances.
Spectral bleed-through occurs when donor emission leaks into the acceptor detection channel, or when the excitation light used for the donor also directly excites the acceptor. Both effects inflate the apparent acceptor signal and must be corrected mathematically using control samples labeled with only one fluorophore at a time.
Incomplete labeling is a particular concern in experiments using fluorescent protein fusions or antibody-conjugated dyes. If a proportion of the molecules of interest carry only a donor or only an acceptor, the measured FRET efficiency will be diluted compared to the true value in interacting pairs. Careful characterization of labeling efficiency is essential before interpreting FRET data quantitatively.
Photobleaching of the donor or acceptor during image acquisition can mimic or mask FRET signals. Using photostable fluorophores, minimizing excitation intensity, and collecting time-series data with appropriate controls all help to distinguish genuine FRET from bleaching artifacts. For experiments in living cells, FLIM-FRET is often preferred precisely because lifetime measurements are less sensitive to intensity fluctuations caused by photobleaching or focus drift.
How BioSPX supports FRET-based research in the Benelux
Researchers in Belgium, the Netherlands, and Luxembourg who want to integrate FRET into their imaging workflows need instruments that combine sensitivity, quantitative precision, and flexibility across measurement modes. BioSPX supports this need through its portfolio of imaging and microscopy solutions, offering guidance tailored to the specific requirements of each laboratory.
- Access to multimode imaging systems capable of intensity-based and lifetime-based FRET measurements
- Expert advice from product specialists on fluorophore selection, experimental design, and instrument configuration
- Installation, user training, and ongoing maintenance support to ensure data quality and reproducibility
- Pre- and post-sales guidance for both established research groups and laboratories setting up FRET workflows for the first time
If you are exploring how FRET-based imaging could support your research, contact the BioSPX team to discuss your experimental needs and find the most suitable solution for your laboratory.
Frequently Asked Questions
How do I know if my experimental setup is suitable for FRET measurements?
Your setup needs to support at least two spectrally distinct detection channels and ideally allow control over excitation wavelengths independently. For sensitized emission FRET, a standard widefield or confocal microscope with appropriate filter sets is sufficient, but you will need single-labeled control samples to correct for bleed-through. For FLIM-FRET, a time-correlated single-photon counting (TCSPC) or time-gated system is required — if your current instrument lacks this capability, consulting with a specialist (such as the BioSPX team) can help you identify the right upgrade or alternative platform.
Can FRET be used to study interactions in live cells over long time periods?
Yes, but sustained live-cell FRET imaging introduces challenges around phototoxicity, fluorophore photobleaching, and focus drift that must be actively managed. FLIM-FRET is the preferred approach for long time-course experiments because fluorescence lifetime measurements are inherently insensitive to intensity fluctuations caused by bleaching or cell movement. Minimizing laser power, using photostable fluorophore pairs, and incorporating regular reference measurements into your acquisition protocol will significantly improve data reliability over extended imaging sessions.
What is the difference between FRET and co-localization, and why does it matter?
Co-localization simply means that two fluorescently labeled molecules appear in the same diffraction-limited pixel or voxel — a region that can be 200 nm or larger — which does not confirm direct molecular interaction. FRET, by contrast, only produces a signal when the two fluorophores are within roughly 1 to 10 nanometers of each other, which is the scale of a genuine physical interaction or binding event. Relying on co-localization alone to conclude that two proteins interact is a common and consequential mistake; FRET provides the nanometer-scale evidence needed to make that claim rigorously.
How do I choose between sensitized emission and FLIM-FRET for my experiment?
If your primary goal is qualitative detection of an interaction or you are working with a standard confocal system without lifetime capabilities, sensitized emission is a practical starting point — provided you apply rigorous bleed-through corrections. If you need quantitative, reproducible FRET efficiency values, are imaging samples with variable fluorophore concentrations, or are tracking dynamic interactions in live cells over time, FLIM-FRET is the more reliable choice because it is independent of fluorophore concentration and excitation intensity. Acceptor photobleaching is a good intermediate option for fixed samples when you want a straightforward internal control without investing in lifetime hardware.
What is the orientation factor and how much should I worry about it in practice?
The orientation factor, denoted κ² (kappa-squared), describes how the relative orientation of the donor and acceptor dipole moments affects energy transfer efficiency — perpendicular orientations can theoretically reduce FRET to zero even at short distances. In practice, most live-cell FRET experiments assume κ² = 2/3, which applies when both fluorophores rotate freely and rapidly relative to the FRET timescale, a reasonable assumption for fluorescent protein fusions with flexible linkers. However, if your fluorophores are rigidly attached or you are calculating absolute distances for structural biology purposes, you should experimentally assess dipole orientation using fluorescence anisotropy measurements before drawing quantitative conclusions.
Are there common mistakes beginners make when setting up their first FRET experiment?
The most frequent beginner mistakes are skipping single-labeled controls, choosing fluorophore pairs with poor spectral overlap or excessive bleed-through, and over-expressing tagged constructs to levels where non-specific crowding produces artifactual FRET signals. Another common pitfall is interpreting a decrease in donor signal alone as evidence of FRET without simultaneously confirming the corresponding increase in acceptor emission or change in donor lifetime. Building a rigorous set of positive and negative controls — including a construct where the donor and acceptor are tethered at a known distance — before moving to your biological question will save considerable troubleshooting time later.
Can FRET be combined with other super-resolution or advanced microscopy techniques?
Yes, and this is an active area of methodological development. Single-molecule FRET (smFRET) combined with total internal reflection fluorescence (TIRF) microscopy allows researchers to measure distance distributions and conformational dynamics at the level of individual molecules, revealing heterogeneity that ensemble measurements would average out. FRET has also been integrated with fluorescence correlation spectroscopy (FCS) and light-sheet microscopy for specific applications. These combinations typically require careful instrument configuration and more complex data analysis, so they are best approached once you have a solid foundation in standard ensemble FRET measurements.
Related Articles
- Why does fluorescence lifetime provide information beyond fluorescence intensity?
- How does environmental control affect data quality in long-term cell experiments?
- How does cancer spread to other parts of the body?
- How do oncologists monitor treatment progress?
- What is the difference between primary and secondary cancer?
This content was generated with the help of AI and it may contain mistakes